Traditional development evaluation has been characterized as ‘backward looking’ rather than forward looking and too focused on proving over improving. Some believe applying an ‘agile’ approach in development would be more useful — the assumption being that if you design a program properly and iterate rapidly and constantly based on user feedback and data analytics, you are more likely achieve your goal or outcome without requiring expensive evaluations. The idea is that big data could eventually allow development agencies to collect enough passive data about program participants that there would no longer be a need to actively survey people or conduct a final evaluation, because there would be obvious patterns that would allow implementers to understand behaviors and improve programs along the way.
The above factors have made some evaluators and data scientists question whether big data and real-time availability of multiple big data sets, along with the technology that enables their collection and analysis, will make evaluation as we know it obsolete. Others have argued that it’s not the end of evaluation, but rather we will see a blending of real-time monitoring, predictive modeling, and impact evaluation, depending on the situation. Big questions remain, however, about the feasibility of big data in some contexts. For example, are big data approaches useful when it comes to people who are not producing very much digital data? How will the biases in big data be addressed to ensure that the poorest, least connected, and/or most marginalized are represented?
The Technology Salon on Big Data and Evaluation hosted during November’s American Evaluation Association Conference in Chicago opened these questions up for consideration by a roomful of evaluators and a few data scientists. We discussed the potential role of new kinds and quantities of data. We asked how to incorporate static and dynamic big data sources into development evaluation. We shared ideas on what tools, skills, and partnerships we might require if we aim to incorporate big data into evaluation practice. This rich and well-informed conversation was catalyzed by our lead discussants: Andrew Means, Associate Director of the Center for Data Science & Public Policy at the University of Chicago and Founder of Data Analysts for Social Good and The Impact Lab; Michael Bamberger, Independent Evaluator and co-author of Real World Evaluation; and Veronica Olazabal from The Rockefeller Foundation. The Salon was supported by ITAD via a Rockefeller Foundation grant.
What do we mean by ‘big data’?
The first task was to come up with a general working definition of what was understood by ‘big data.’ Very few of the organizations present at the Salon were actually using ‘big data’ and definitions varied. Some talked about ‘big data sets’ as those that could not be collected or analyzed by a human on a standard computer. Others mentioned that big data could include ‘static’ data sets (like government census data – if digitized — or cellphone record data) and ‘dynamic’ data sets that are being constantly generated in real time (such as streaming data input from sensors or ‘cookies’ and ‘crumbs’ generated through use of the Internet and social media). Others considered big data to be real time, socially-created and socially-driven data that could be harvested without having to purposely collect it or budget for its collection. ‘It’s data that has a life of its own. Data that just exists out there.’ Yet others felt that for something to be ‘big data’ multiple big data sets needed to be involved, for example, genetic molecular data crossed with clinical trial data and other large data sets, regardless of static or dynamic nature. Big data, most agreed, is data that doesn’t easily fit on a laptop and that requires a specialized skill set that most social scientists don’t have. ‘What is big data? It’s hard to define exactly, but I know it when I see it,’ concluded one discussant.
Why is big data a ‘thing’?
As one discussant outlined, recent changes in technology have given rise to big data. Data collection, data storage and analytical power are becoming cheaper and cheaper. ‘We live digitally now and we produce data all the time. A UPS truck has anywhere from 50-75 sensors on it to do everything from optimize routes to indicate how often it visits a mechanic,’ he said. ‘The analytic and computational power in my iPhone is greater than what the space shuttle had.’ In addition, we have ‘seamless data collection’ in the case of Internet-enabled products and services, meaning that a person creates data as they access products or services, and this can then be monetized, which is how companies like Google make their money. ‘There is not someone sitting at Google going — OK, Joe just searched for the nearest pizza place, let me enter that data into the system — Joe is creating the data about his search while he is searching, and this data is a constant stream.’
What does big data mean for development evaluation?
Evaluators are normally tasked with making a judgment about the merit of something, usually for accountability, learning and/or to improve service delivery, and usually looking back at what has already happened. In the wider sense, the learning from evaluation contributes to program theory, needs assessment, and many other parts of the program cycle.
This approach differs in some key ways from big data work, because most of the new analytical methods used by data scientists are good at prediction but not very good at understanding causality, which is what social scientists (and evaluators) are most often interested in. ‘We don’t just look at giant data sets and find random correlations,’ however, explained one discussant. ‘That’s not practical at all. Rather, we start with a hypothesis and make a mental model of how different things might be working together. We create regression models and see which performs better. This helps us to know if we are building the right hypothesis. And then we chisel away at that hypothesis.’
Some challenges come up when we think about big data for development evaluation because the social sector lacks the resources of the private sector. In addition, data collection in the world of international development is not often seamless because ‘we care about people who do not live in the digital world,’ as one person put it. Populations we work with often do not leave a digital trail. Moreover, we only have complete data about the entire population in some cases (for example, when it comes to education in the US), meaning that development evaluators need to figure out how to deal with bias and sampling.
Satellite imagery can bring in some data that was unavailable in the past, and this is useful for climate and environmental work, but we still do not have a lot of big data for other types of programming, one person said. What’s more, wholly machine-based learning, and the kind of ‘deep learning’ made possible by today’s computational power is currently not very useful for development evaluation.
Evaluators often develop counterfactuals so that they can determine what would have happened without an intervention. They may use randomized controlled trials (RCTs), differentiation models, statistics and economics research approaches to do this. One area where data science may provide some support is in helping to answer questions about counterfactuals.
More access to big data (and open data) could also mean that development and humanitarian organizations stop duplicating data collection functions. Perhaps most interestingly, big data’s predictive capabilities could in the future be used in the planning phase to inform the kinds of programs that agencies run, where they should be run, and who should be let into them to achieve the greatest impact, said one discussant. Computer scientists and social scientists need to break down language barriers and come together more often so they can better learn from one another and determine where their approaches can overlap and be mutually supportive.
Are we all going to be using big data?
Not everyone needs to use big data. Not everyone has the capacity to use it, and it doesn’t exist for offline populations, so we need to be careful that we are not forcing it where it’s not the best approach. As one discussant emphasized, big data is not magic, and it’s not universally applicable. It’s good for some questions and not others, and it should be considered as another tool in the toolbox rather than the only tool. Big data can provide clues to what needs further examination using other methods, and thus most often it should be part of a mixed methods approach. Some participants felt that the discussion about big data was similar to the one 20 years ago on electronic medical records or to the debate in the evaluation community about quantitative versus qualitative methods.
What about groups of people who are digitally invisible?
There are serious limitations when it comes to the data we have access to in the poorest communities, where there are no tablets and fewer cellphones. We also need to be aware of ‘micro-exclusion’ (who within a community or household is left out of the digital revolution?) and intersectionality (how do different factors of exclusion combine to limit certain people’s digital access?) and consider how these affect the generation and interpretation of big data. There is also a question about the intensity of the digital footprint: How much data and at what frequency is it required for big data to be useful?
Some Salon participants felt that over time, everyone would have a digital presence and/or data trail, but others were skeptical. Some data scientists are experimenting with calibrating small amounts of data and comparing them to human-collected data in an attempt to make big data less biased, a discussant explained. Another person said that by digitizing and validating government data on thousands (in the case of India, millions) of villages, big data sets could be created for those that are not using mobiles or data.
Another person pointed out that generating digital data is a process that involves much more than simple access to technology. ‘Joining the digital discussion’ also requires access to networks, local language content, and all kinds of other precursors, she said. We also need to be very aware that these kinds of data collection processes impact on people’s participation and input into data collection and analysis. ‘There’s a difference between a collective evaluation activity where people are sitting around together discussing things and someone sitting in an office far from the community getting sound bites from a large source of data.’
Where is big data most applicable in evaluation?
One discussant laid out areas where big data would likely be the most applicable to development evaluation:

It would appear that big data has huge potential in the evaluation of complex programs, he continued. ‘It’s fairly widely accepted that conventional designs don’t work well with multiple causality, multiple actors, multiple contextual variables, etc. People chug on valiantly, but it’s expected that you may get very misleading results. This is an interesting area because there are almost no evaluation designs for complexity, and big data might be a possibility here.’
In what scenarios might we use big data for development evaluation?
This discussant suggested that big data might be considered useful for evaluation in three areas:
- Supporting conventional evaluation design by adding new big data generated variables. For example, one could add transaction data from ATMs to conventional survey generated poverty indicators
- Increasing the power of a conventional evaluation design by using big data to strengthen the sample selection methodology. For example, satellite images were combined with data collected on the ground and propensity score matching was used to strengthen comparison group selection for an evaluation of the effects of interventions on protecting forest cover in Mexico.
- Replacing a conventional design with a big data analytics design by replacing regression based models with systems analysis. For example, one could use systems analysis to compare the effectiveness of 30 ongoing interventions that may reduce stunting in a sample of villages. Real-time observations could generate a time-series that could help to estimate the effectiveness of each intervention in different contexts.
It is important to remember construct validity too. ‘If big data is available, but it’s not quite answering the question that you want to ask, it might be easy to decide to do something with it, to run some correlations, and to think that maybe something will come out. But we should avoid this temptation,’ he cautioned. ‘We need to remember and respect construct validity and focus on measuring what we think we are measuring and what we want to measure, not get distracted by what a data set might offer us.’
What about bias in data sets?
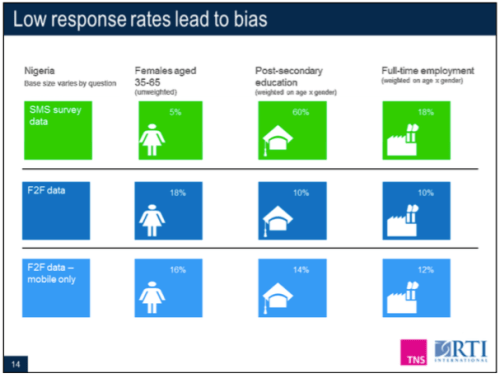
We also need to be very aware that big data carries with it certain biases that need to be accounted for, commented several participants; notably, when working with low connectivity populations and geographies or when using data from social media sites that cater to a particular segment of the population. One discussant shared an example where Twitter was used to identify patterns in food poisoning, and suddenly the upscale, hipster restaurants in the city seemed to be the problem. Obviously these restaurants were not the sole source of the food poisoning, but rather there was a particular kind of person that tended to use Twitter.
‘People are often unclear about what’s magical and what’s really possible when it comes to big data. We want it to tell us impossible things and it can’t. We really need to engage human minds in this process; it’s not a question of everything being automated. We need to use our capacity for critical thinking and ask: Who’s creating the data? How’s it created? Where’s it coming from? Who might be left out? What could go wrong?’ emphasized one discussant. ‘Some of this information can come from the metadata, but that’s not always enough to make certain big data is a reliable source.’ Bias may also be introduced through the viewpoints and unconscious positions, values and frameworks of the data scientists themselves as they are developing algorithms and looking for/finding patterns in data.
What about the ethical and privacy implications?
Big Data has a great deal of ethical and privacy implications. Issues of consent and potential risk are critical considerations, especially when working with populations that are newly online and/or who may not have a good understanding of data privacy and how their data may be used by third parties who are collecting and/or selling it. However, one participant felt that a protectionist mentality is misguided. ‘We are pushing back and saying that social media and data tracking are bad. Instead, we should realize that having a digital life and being counted in the world is a right and it’s going to be inevitable in the future. We should be working with the people we serve to better understand digital privacy and help them to be more savvy digital citizens.’ It’s also imperative that aid and development agencies abandon our slow and antiquated data collection systems, she said, and to use the new digital tools that are available to us.
How can we be more responsible with the data we gather and use?
Development and humanitarian agencies do need be more responsible with data policies and practices, however. Big data approaches may contribute to negative data extraction tendencies if we mine data and deliver it to decision-makers far away from the source. It will be critical for evaluators and big data practitioners to find ways to engage people ‘on the ground’ and involve more communities in interpreting and querying their own big data. (For more on responsible data use, see the Responsible Development Data Book. Oxfam also has a responsible data policy that could serve as a reference. The author of this blog is working on a policy and practice guide for protecting girls digital safety, security and privacy as well.)
Who should be paying for big data sets to be made available?
One participant asked about costs and who should bear the expense of creating big data sets and/or opening them up to evaluators and/or data scientists. Others asked for examples of the private sector providing data to the social sector. This highlighted additional ethical and privacy issues. One participant gave an example from the healthcare space where there is lots of experience in accessing big data sets generated by government and the private sector. In this case, public and private data sets needed to be combined. There were strict requirements around anonymization and the effort ended up being very expensive, which made it difficult to build a business case for the work.
This can be a problem for the development sector, because it is difficult to generate resources for resolving social problems; there is normally only investment if there is some kind of commercial gain to be had. Some organizations are now hiring ‘data philanthropist’ positions that help to negotiate these kinds of data relationships with the private sector. (Global Pulse has developed a set of big data privacy principles to guide these cases.)
So, is big data going to replace evaluation or not?
In conclusion, big data will not eliminate the need for evaluation. Rather, it’s likely that it will be integrated as another source of information for strengthening conventional evaluation design. ‘Big Data and the underlying methods of data science are opening up new opportunities to answer old questions in new ways, and ask new kinds of questions. But that doesn’t mean that we should turn to big data and its methods for everything,’ said one discussant. ‘We need to get past a blind faith in big data and get more practical about what it is, how to use it, and where it adds value to evaluation processes,’ said another.
Thanks again to all who participated in the discussion! If you’d like to join (or read about) conversations like this one, visit Technology Salon. Salons run under Chatham House Rule, so no attribution has been made in this summary post.
Read Full Post »


 The
The 
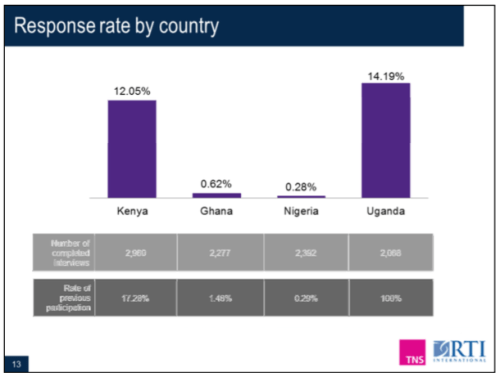
 Lastly, the research found no meaningful difference in response rate between a survey with 8 questions and one with 16 questions, she said. This may go against common convention which dictates that “the shorter, the better” for an SMS survey. There was no observable break off rate based on survey length, giving confidence that longer surveys may be possible via SMS than initially thought.